

Description
E.coli Host Cell DNA Residue Detection Kit is used for the quantitative analysis of E.coli host cell DNA residuce in intermediate samples, semi-finished and finished products of various biological products.
This kit adopts Taqman fluorescent probe and the polymerase chain reaction (PCR) method, which has fg level minimum detection limit and can specifically and quickly detect the residual E.coli cell DNA. The kit needs to be used together with the the Residual DNA Sample Preparation Kit (Cat# 18461ES).
Specifications
|
Cat.No. |
41308ES50-EN / 41308ES60-EN |
|
Size |
50 T-EN / 100 T-EN |
Components
|
Components No. |
Name |
41308ES50-EN |
41308ES60-EN |
|
41308-A |
E.coli qPCR Mix |
0.75 mL |
1.5 mL |
|
41308-B |
E.coli Primer&Probe Mix |
250 μL |
500 μL |
|
41308-C |
DNA Dilution Buffer |
2×1.8 mL |
4×1.8 mL |
|
41308-D |
E.coli DNA Control(30 ng/μL) |
25 μL |
50 μL |
Storage
This product should be stored at -25~-15℃ for 2 years.
Both 41308-A and 41308-B should be stored protected from light.
Applicable instrument models
Include but not limited to:
Bio-Rad: CFX96 Optic Module.
Thermo Scientific: ABI 7500; ABI Quant Studio 5.
Instructions
Figures
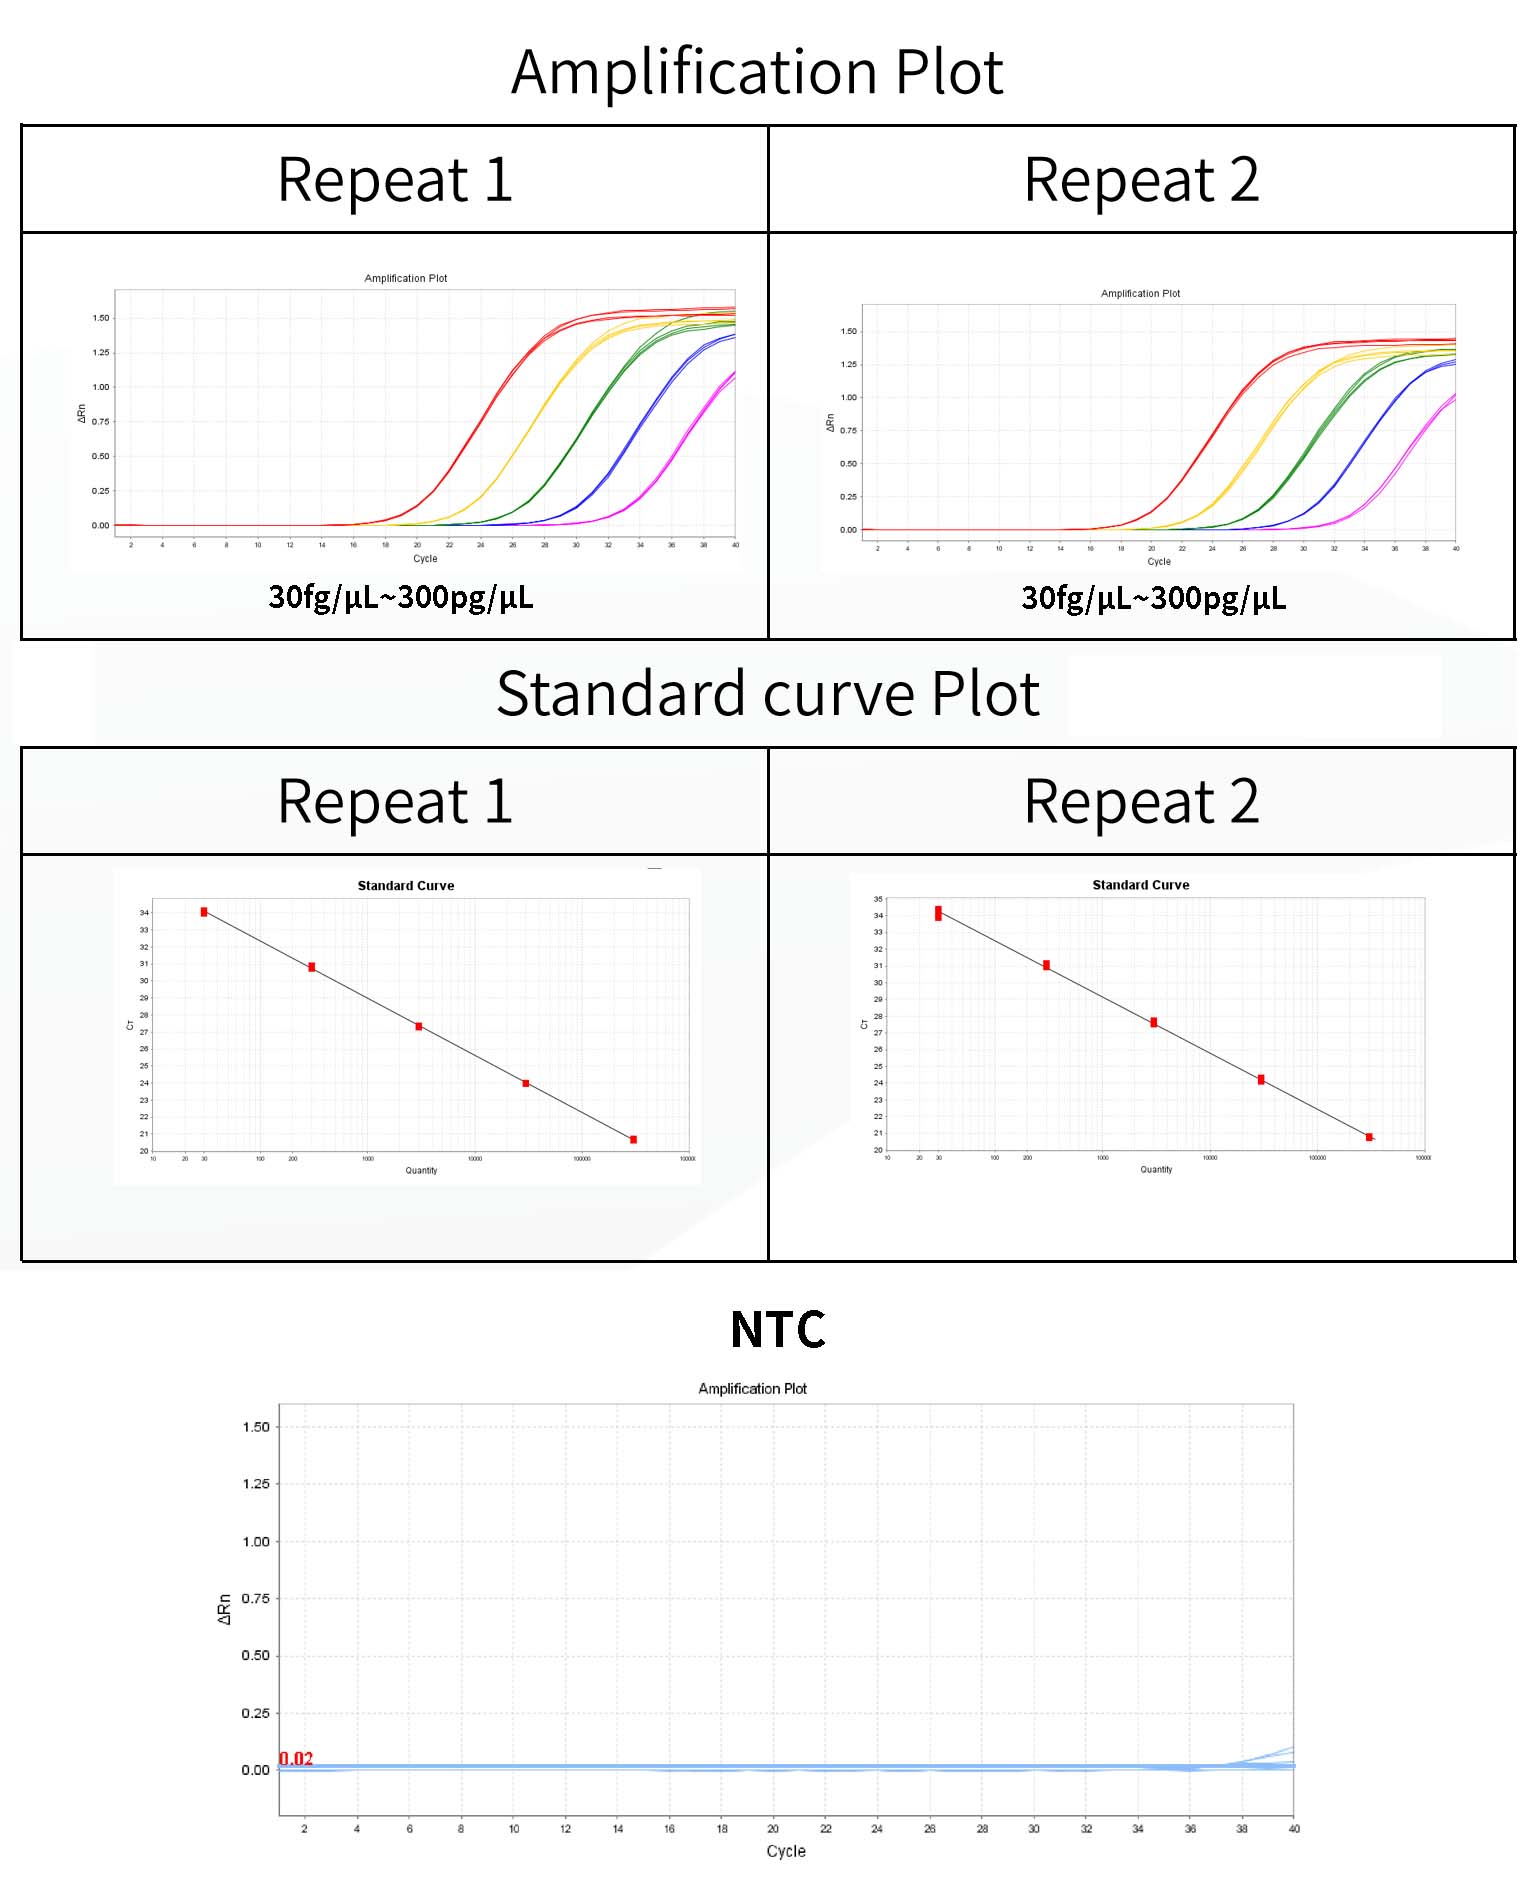
1.Good linearity: Linear range from 30 fg/μL ~ 300 pg/μL, R²= 1.000, Eff=101.74%, CV<15%.


Figure 1. Standard curve for E. coli DNA qPCR assay.
2. Specificity
To assess interference from host-cell genomic DNA used in biopharmaceutical production, genomic DNA from HEK293, Vero, and CHO cells was tested. No cross-reactivity or signal interference was observed, and the amplification curves fully overlapped with the negative controls.

Figure 2. Specificity/interference test results.
3. High Recovery
E. coli DNA (3 pg/μL) was spiked into five challenging matrices—high protein, high nucleic acid, high salt, high pH, and low pH. Each sample was extracted in duplicate and tested in triplicate by qPCR.
Across all matrices, recovery remained within 70–130% with CVs below 20%, confirming reliable performance under diverse sample conditions.
Table 1. Recovery of Spiked Simulated Samples
|
Sample Type |
Theoretical Concentration (pg/μL) |
Extraction 1 (pg/μL) |
Extraction 2 (pg/μL) |
Average Measured Concentration (pg/μL) |
CV (%) |
Recovery (%) |
|
Baseline Sample |
— |
— |
— |
— |
— |
— |
|
High Protein |
3 |
2.25 |
2.23 |
2.24 |
1.09 |
74.74 |
|
High Nucleic Acid |
3 |
3.93 |
3.96 |
3.95 |
1.56 |
131.52 |
|
High Salt |
3 |
2.69 |
2.67 |
2.68 |
2.63 |
89.20 |
|
High pH |
3 |
2.90 |
3.67 |
3.29 |
13.82 |
109.55 |
|
Low pH |
3 |
2.77 |
2.87 |
2.82 |
3.41 |
94.01 |
4. Limit of Quantification (LOQ): 30 fg/μL.
E. coli DNA at 50 fg/μL, 40 fg/μL, 30 fg/μL, 10 fg/μL, and 5 fg/μL was tested with 10 replicates per concentration. Results showed that at 30 fg/μL and above, the CV was < 20%, indicating that the limit of quantification (LOQ) of the E. coli Host Cell DNA Residual Detection Kit (2G) is 30 fg/μL.
|
Replicate |
E. coli DNA (fg/μL) |
Back-calculated (%) |
|
1 |
29.43 |
98.09 |
|
2 |
29.51 |
98.35 |
|
3 |
32.04 |
106.79 |
|
4 |
26.07 |
86.89 |
|
5 |
34.06 |
113.53 |
|
6 |
33.54 |
111.79 |
|
7 |
26.95 |
89.82 |
|
8 |
27.38 |
91.26 |
|
9 |
27.04 |
90.13 |
|
10 |
26.10 |
87.02 |
|
Mean |
29.21 |
— |
|
CV (%) |
10.40 |
— |

Figure 3. qPCR results for 30 fg/μL E. coli DNA
Documents:
Safety Data Sheet
Manuals
41308_Manual_Ver.EN20231015.pdf
Related Blog
Payment & Security
Your payment information is processed securely. We do not store credit card details nor have access to your credit card information.
You may also like
Inquiry
FAQ
The product is for research purposes only and is not intended for therapeutic or diagnostic use in humans or animals. Products and content are protected by patents, trademarks, and copyrights owned by Yeasen Biotechnology. Trademark symbols indicate the country of origin, not necessarily registration in all regions.
Certain applications may require additional third-party intellectual property rights.
Yeasen is dedicated to ethical science, believing our research should address critical questions while ensuring safety and ethical standards.