
Description
Hieff Unicon™ Universal Blue qPCR Master Mix (Probe Based) is a pre-solution for 2×real-time quantitative PCR amplification characterized by high sensitivity and specificity, is blue in color, and has the effect of sample addition.
This product is a 2× Mix pre-mixed reagent that enables up to four fluorescent quantitative PCR reactions in a single reaction well. This product contains the genetically modified antibody method to hot-start Taq enzyme, greatly improving the amplification sensitivity and specificity. At the same time, this product has deeply optimized the multi-reaction buffer, which can improve the amplification efficiency of the reaction and promote the effective amplification of low-concentration templates. This product can be used for genotyping and multiplex quantitative analysis.
The kit features built-in hot start, compatible with all mainstream qPCR instruments, and offers excellent stability and sensitivity.
Features
- Strong tolerance of blood impurities
- High sensitivity
- Super storage stability
Application
- Pathogen detection
- Copy number analysis
- SNP genotyping
Specification
Applied Biosystems: 5700, 7000, 7300, 7700, 7900HT Fast, StepOne™, StepOne Plus™, 7500, 7500 Fast, ViiA™7, QuantStudio™ 3 and 5, QuantStudio™ 6,7,12k Flex; Bio-Rad: CFX96, CFX384, iCycler iQ, iQ5, MyiQ, MiniOpticon, Opticon, Opticon 2, Chromo4; Eppendorf: Mastercycler ep realplex, realplex 2 s; Qiagen: Corbett Rotor-Gene Q, Rotor-Gene 3000, Rotor-Gene 6000; Roche Applied Science: LightCycler 480, LightCycler 2.0; Lightcycler 96; Stratagene: MX3000P™, MX3005P™, MX4000P™; Thermo Scientific: PikoReal Cycler; Cepheid: SmartCycler; Illumina: Eco qPCR.
| Hot Start | Built-in hot start |
| Detection method | Primer-probe detection |
| PCR method | qPCR |
| Polymerase | Taq DNA polymerase |
| Type of sample | DNA |
| Application equipment |
Components
| No. | Name | 11211ES03 100T |
11211ES08 500T |
11211ES20 2,000T |
11211ES61 10,000T |
| 11211 | Hieff Unicon™Universal Multiplex qPCR Master Mix (Probe Based) | 1 mL | 5×1 mL | 20 mL | 100 mL |
PCR Reaction setup
| Components | Volume (μL) | Final Concentration |
| 2× Hieff Unicon™ Universal TaqMan multiplex qPCR master mix | 12.5 | 1× |
| Primer mix (10 μmol/L) | x | 0.1-0.5 μmol/L |
| Probe mix (10 μmol/L) | x | 50-250 nmol/L |
| Rox reference dye | 0.4 | 1× |
| Template DNA/cDNA | 1-10 | - |
| ddH2O | up to 25 | - |
Rox reference dye is optional
Cycle Setup
| CYCLE STEP | TEMPERATURE | TIME | CYCLES |
| Initial Denaturation | 95°C | 5 mins | 1 |
| Denaturation Extension |
95°C 60°C |
15 secs 30 secs |
40-45 |
Shipping and Storage
The product is shipped with dry ice and can be stored at -15℃ ~ -25℃ for 2 year.
Figures
Figure 1 High stability: 37℃ thermal acceleration stability
The red line: 37℃ thermal acceleration 0 day; The yellow line: 37℃ thermal acceleration 7 days; The green line: 37℃ thermal acceleration 14 days
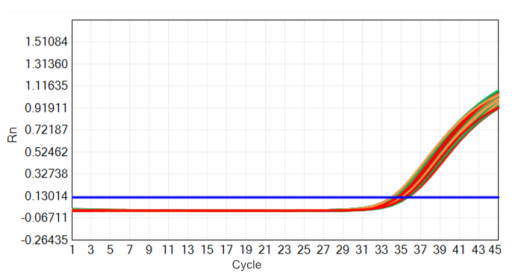
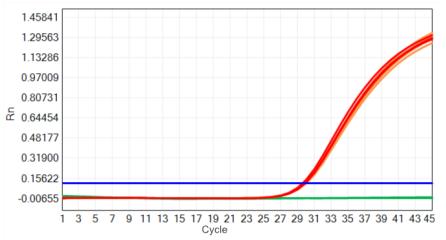
Figure 2 High stability: freeze-thaw stability
The red line: freeze thaw 0 time; The yellow line: freeze thaw 50 times; The green line: NTC
FAQ
Q: What is the amount of the template X? What is the commonly used amount?
A: (1) The amount of template DNA is something that the experimenter needs to figure out during the first experiment. First, dilute the template DNA (generally, a 5-10 fold dilution is recommended), then load the samples at different template concentrations, and select the optimal loading amount with a CT value ranging from 20 to 30.
(2) The commonly used amount is 500-1000 ng of total RNA for reverse transcription, which is diluted 10 times and 1 μL of cDNA is taken for the qPCR experiment.
Q: What is the validity of the qPCR experiment results? Why is it recommended that the Ct value should be greater than 15?
A: a) The effectiveness must meet the following three conditions:
(1) Standard curve: Amplification efficiency range: 90 - 110%, corresponding slope is -3 -- 3.5. R² > 0.98. (Amplification efficiency = 10^(-1/slope - 1)), when the slope = -3.32, the amplification efficiency = 100%.
(2) Amplification curve: A S-shaped curve, with the Ct value ranging from 15 to 35. The Ct value of the negative control is greater than 35 or there is no Ct value.
(3) Melting curve: A single peak.
b) The 10 times the standard deviation of the fluorescence values for 3 to 15 cycles is the fluorescence threshold. A too small Ct value will affect the curve.
Q: What is the function of Rox?
A: ROX is a reference dye. Its function is to standardize the non-PCR oscillations in the fluorescence quantitative reaction, correct the sample addition errors or the errors between wells, and provide a stable baseline.
Q: Why is the amplification curve unstable (with a jagged plateau in the amplification curve)?
A: Possible reasons:
a) The purity of RNA is low, and there are many impurities in the system; recommended parameters: OD260/OD280 = 1.8 - 2.0, OD260/OD230 > 2.0.
b) The instrument has not been calibrated for a long time.
Solution: Increase template dilution, prepare high-purity RNA, calibrate instrument regularly.
Q: Why doesn't the amplification curve reach the plateau stage?
A: Possible reasons: low template quantity, too few cycles, low amplification efficiency.
Solution: Increase template amount, set cycles to 40-45, replace reagents if needed.
Q: Why do two peaks appear?
A: Mainly caused by primer dimers or non-specific amplification.
Solution: Increase annealing temperature, adjust primer/template concentration, redesign primers.
Documents:
Safety Data Sheet
Manuals
Citations & References:
[1] Zhang P, Lu S, Liu Z, et al. Transcriptomic and Metabolomic Profiling Reveals the Effect of LED Light Quality on Fruit Ripening and Anthocyanin Accumulation in Cabernet Sauvignon Grape. Front Nutr. 2021;8:790697.
[2] Xu B, Zhang C, Jiang A, et al. Histone methyltransferase Dot1L recruits O-GlcNAc transferase to target chromatin sites to regulate histone O-GlcNAcylation. J Biol Chem. 2022;298(7):102115.
Payment & Security
Your payment information is processed securely. We do not store credit card details nor have access to your credit card information.
You may also like
Inquiry
FAQ
The product is for research purposes only and is not intended for therapeutic or diagnostic use in humans or animals. Products and content are protected by patents, trademarks, and copyrights owned by Yeasen Biotechnology. Trademark symbols indicate the country of origin, not necessarily registration in all regions.
Certain applications may require additional third-party intellectual property rights.
Yeasen is dedicated to ethical science, believing our research should address critical questions while ensuring safety and ethical standards.