
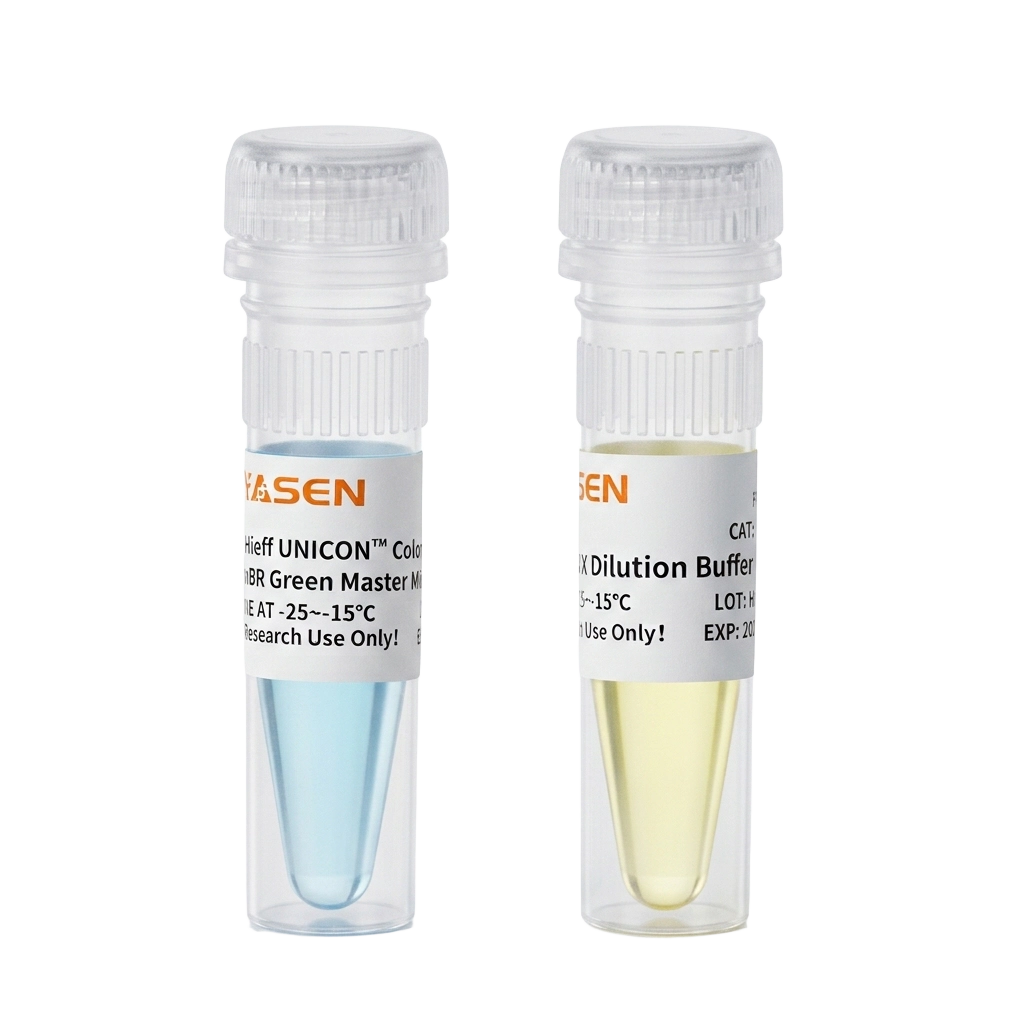
Hieff UNICON™ ColorGPS qPCR 마스터 믹스(Low Rox) _ 11189ES

$15.00 절약하세요
Yeasen제품번호: 11189ES03

크기: 1ml(1ml)
가격:
판매 가격$40.00 일반 가격$55.00
재고:
재고 있음

Hieff UNICON™ ColorGPS qPCR Master Mix(Low Rox)는 높은 형광 강도, 높은 감도 및 특이성, 높은 증폭 수율을 특징으로 하는 2× 실시간 정량 PCR 증폭을 위한 사전 솔루션입니다. 핵심 구성 요소인 Hieff UNICON™ Taq DNA Polymerase는 항체 방법으로 핫 스타트되어 샘플 준비 중 프라이머 어닐링으로 인한 비특이적 증폭을 효과적으로 억제할 수 있습니다. 동시에 이 공식은 PCR 반응의 증폭 효율을 향상시키는 요소와 다양한 GC 함량(30~70%)을 가진 유전자의 증폭을 균등화하는 촉진제를 추가하여 정량 PCR이 광범위한 정량 영역에서 양호한 선형 관계를 얻을 수 있습니다. 이 제품은 다양한 염료의 혼합 색상 변화 반응을 활용하여 피펫팅 작업을 모니터링하여 피펫팅 오류 발생을 효과적으로 줄입니다.

특징

피펫팅 추적: 누락/추가 오류 위험 감소

우수한 증폭: 넓은 선형 범위에 걸쳐 우수한 선형성

높은 정밀도: 2배 농도 차이로 템플릿을 정확하게 구별할 수 있습니다.

우수한 반복성: 반복 웰의 웰 간 변동성이 작아 반복성이 더 우수합니다.

안정적이고 신뢰할 수 있음: 반응 시스템은 실온에서 24시간 동안 보관할 수 있으며 제품은 20번의 동결-해동 사이클 후에도 영향을 받지 않습니다.

응용 프로그램

유전자 발현 차이 분석

절대적 정량 분석

명세서

집중

2 × (qPCR 믹스)

검출방법

염색방법

PCR 방법

정자수소핵산분해효소(PCR)

중합효소

Taq DNA 중합효소

샘플의 종류

DNA

응용장비

Applied Biosystems 7500, 7500 Fast, ViiA7;Stratagene MX4000, MX3005P, MX3000P 및 저농도 ROX Reference Dye를 추가해야 하는 기타 형광 정량 PCR 장비

제품 유형

실시간 형광 정량 PCR을 위한 프리믹스

(신청)에 적용하다

유전자 발현

구성 요소

구성품 번호

이름

1 1189 ES03

1 1189 ES08

1 1189 ES60

1118 9 -아

Hieff UNICON ™ ColorGPS qPCR 마스터 믹스 ( 로우 록스 )​

1ml(1ml)

5×1ml

100×1ml

1118 9 -비

10×희석 완충액

1ml(1ml)

1ml(1ml)

20×1ml

배송 및 보관

본 제품은 -25~-15℃에서 1년간 보관하시기 바랍니다.

그림

그림 1. 동적 범위 내에서 신뢰할 수 있는 결과를 얻을 수 있습니다.

10^1-10^7의 기울기를 가진 2 µL의 플라스미드 템플릿을 사용하여 관련 유전자를 증폭했습니다. Hieff UNICON ™ ColorGPS 마스터 믹스는 7개의 크기의 템플릿 양을 효과적으로 감지하여 넓은 선형 범위 내에서 우수한 선형성을 달성할 수 있습니다.

그림 2. 2배의 템플릿 농도 차이를 정확하게 구분할 수 있습니다.

2배 농도 구배로 희석한 플라스미드 2 µL를 템플릿으로 사용하여 관련 유전자를 증폭했습니다. Hieff UNICON ™ ColorGPS 마스터 믹스는 템플릿 농도 차이를 정확하게 해결할 수 있습니다.

그림 3. 작은 우물 간 변동성이 관찰되어 더 나은 반복성을 보여줍니다.

수십 개의 플라스미드 사본을 템플릿으로 사용하여 각각의 지침서에 명시된 절차에 따라 다양한 형광 정량 시약으로 증폭을 수행했습니다. SD 값은 다른 역전사 시약과 비교했을 때 신제품이 복제 웰 간 차이가 작고 반복성이 더 우수함을 나타냅니다.

그림 4. 더 유연하고 표준 또는 빠른 절차에 적합함.

표준 절차에서는 변성 시간과 연장 시간을 각각 10초와 30초로 설정하는 반면, 신속 절차에서는 변성 시간과 연장 시간을 각각 3초와 10초로 설정하여 10개 표적 유전자에 해당하는 Ct 값을 검출합니다. 결과는 표준 절차와 신속 절차 모두에서 신제품으로 얻은 Ct 값이 강한 상관 관계를 가지고 있으며, 신제품은 신속 절차를 사용하여 좋은 결과를 얻을 수 있음을 보여줍니다.

그림 5. 반응 시스템이 준비되면 실온에서 24시간 동안 안정을 유지할 수 있습니다.

마우스, 인간 293 세포, 아라비도프시스 탈리아나의 다른 유전자를 표적으로 사용하여 반응 시스템을 준비한 후, 검출하기 전에 24시간 동안 다른 온도에서 어둠 속에 두었습니다. 즉각적인 처리와 비교했을 때, 다른 유전자에 대한 검출 차이는 0.5 Ct를 초과하지 않아 장시간 작업에서도 안정적인 결과를 얻을 수 있음을 나타냅니다.

서류:

매뉴얼

1 1189 _매뉴얼_ Ver.EN20241218 .pdf

Storage

This product should be stored at -25~-15℃ for 18 months.

FAQ

Please refer to the "YiSheng Biotechnology YiSheng Biotechnology Dye Method Fluorescence Quantitative PCR Mix Selection Table" for details. Click here to learn more and help you choose the appropriate reagents.
For molecular enzyme reagents, simply invert and mix them together, then perform a gentle centrifugation. It is not recommended to vigorously shake to mix them.
Refer to the manual. Ultimately, it is necessary to ensure that after being mixed with the template, the volume is exactly 1×. For example, for 20 μL of cDNA stock solution, add 180 μL of sterile ultrapure water to dilute it 10 times, resulting in 200 μL of diluted template. Take 90 μL of the diluted template and add 10 μL of 10× Dilution Buffer, mix well, and then use it. You can choose not to do this, but it will not affect the result.
You can choose to use the cDNA stock solution or dilute it. Just make sure that the Ct value of the gene you want falls within the range of 15 to 30. Generally, for every 10-fold dilution of cDNA, the Ct value increases by 3.3.
Store in a dark place and the reaction system must not be left open. These two points are essential. It can be placed in a 4℃ refrigerator or at room temperature for 24 hours. Before using, gently shake and centrifuge the sample before loading it onto the instrument. Before loading, carefully check if the tubes or plates have been contaminated.
https://cdn.shopify.com/s/files/1/0803/9419/1166/files/bbbb_1024x1024.png?v=1769394213 When designing primers, it is best to cross introns. The design method can refer to "Enjoyable! A single article to understand qPCR primer design, a must-have skill for experimental experts!" Also, validated primers can be selected. The selection method can refer to "Where to find ready-made qPCR primer sequences?"
The possible reasons are as follows:
1. The instrument has not been calibrated for a long time or it is aging. Usually, the instrument needs to be calibrated once a year. It is necessary to have an instrument engineer perform the calibration or replace the aging components.
2. A 10 μL reaction system was used. The normal system is a 20 μL system. Using half of the normal system would result in an excessively low total concentration of Rox, increasing the probability of BadRox occurrence. It is recommended to conduct the experiment using the 20 μL system.
The specificity of qPCR products can usually be determined through the melting curve. If it is still necessary to determine the products through gel electrophoresis, the qPCR product can undergo electrophoresis. Electrophoresis requires Loading Buffer, and the product cannot be directly loaded for electrophoresis.
1. Confirm whether the signal acquisition function is enabled in the program. If a two-step method is used, the signal acquisition should be set during the annealing extension stage.
2.Is the length of the product too long? If the length of the product is set to 500bp or more, this situation may occur. It is recommended that during primer design, the length of the product be controlled within the range of 80-300bp.
3. Are the primers inappropriate? If the primers are not designed correctly, they need to be redesigned. If the primers are correctly designed but seem to be degraded, PAGE electrophoresis can be used to check the integrity of the primers.
4. Template degradation: Prepare the template anew and repeat the experiment.
The analysis is conducted by observing the melting curve. The melting curve shows that the melting peak shape of NTC does not overlap with that of the corresponding gene, and the TM value of NTC is smaller than that of the corresponding gene. In this case, the product corresponding to NTC is a primer dimer. If the melting curve peak shape of the corresponding gene is a single peak, the collection of the signal of the related gene will not be affected. The melting curve shows that the melting peak shape of NTC overlaps with that of the corresponding gene. In this case, the product corresponding to NTC is likely to be the product of the corresponding gene. The system has been contaminated. We need to check one by one whether the water, primers, or reagents have been contaminated. If none of them have been contaminated, it might be aerosol contamination. Based on the obtained amplification data, the ΔCT value is calculated to determine whether the contamination has a significant impact on the system. If ΔCT ≥ 5, it indicates that the contamination has a minor effect and can be ignored.
It indicates the presence of genomic DNA contamination. It is recommended to use an RNA extraction kit that removes the genome for RNA extraction or during reverse transcription by adding a step to remove the genome. Alternatively, when designing the primers, a design across introns should be adopted.
1. If the CT value is less than 30, but the repeatability is very poor, what should we do? Improve the accuracy of sample addition. Avoid adding small volumes and reduce the error of addition. This can be achieved by preparing a large sample system, for example, mixing primers, water, and qPCR mix into a large system or using the method of mixing primers and water into a large system. The large system needs to be mixed evenly. Improve the accuracy of the pipette's aspiration. Pipettes usually need to be calibrated regularly, once a year.
2. What if CT is ≥ 30 but the repeatability is very poor? At this point, due to the low abundance of the effective template, the randomness of collisions between the template and the primers increases, thereby causing a greater difference between the replicons. It is recommended to try adding 2-3 replicons, and then eliminate the data with large differences for data analysis.
The overlapping peaks in the melting curve are located to the left of the main peak. This might be a situation caused by primer dimerization. One possible solution could be to increase the annealing temperature, reduce the primer concentration, or redesign the primers. The overlapping peaks in the melting curve are located to the right of the main peak. a. It is possible that the non-specific amplification occurred due to poor specificity of the primers. The primers need to be redesigned. b. It is possible that the template DNA was contaminated with genomic DNA. It is recommended to use an RNA extraction kit that removes the genomic DNA for RNA extraction, or to add a step of removing the genomic DNA during reverse transcription to reprepare the cDNA template.

Citations

Documents

Applications

당신은 또한 좋아할 수 있습니다

문의

자주 묻는 질문

이 제품은 연구 목적으로만 사용되며 인간이나 동물의 치료 또는 진단용으로 의도되지 않았습니다. 제품과 콘텐츠는 Yeasen Biotechnology가 소유한 특허, 상표 및 저작권으로 보호됩니다. 상표 기호는 모든 지역에서 반드시 등록되는 것은 아니지만 원산지를 나타냅니다.

특정 애플리케이션에는 추가적인 제3자 지적 재산권이 필요할 수 있습니다.

예슨은 윤리적 과학에 헌신하며, 우리의 연구가 안전과 윤리적 기준을 보장하는 동시에 중요한 문제를 해결해야 한다고 믿습니다.